Hands on Monitoring a Spring Boot Application with Honeycomb 🐝
Application observability - knowing the behavior of your application, on a per user basis - is a critical skill for any tech company. At my current role I’ve been using New Relic to monitor our applications in production. New Relic is great, however recently Honeycomb has broken onto the scene with a new observability platform. Their CEO, Charity Majors, has been leading the conversation around application observability for a while now so I wanted to give their platform a try.
As my experience has been using New Relic to monitor Spring Boot applications, I’ll do the same here. I’ll walk through setting up a basic Spring Boot application, and instrumenting it with Honeycomb. This review should be taken with a grain of salt, as it’s not a formal evaluation. I wrote this as I went, so it reflects my thoughts at the time.
You can check out the source code here
Starting an application
First thing’s first - we need something to monitor! Let’s use the gold standard for bootstrapping a Spring Boot application, Spring Initializr
Let’s build a Java 11, Spring Boot 2.3 service. We’ll call our application honeycomb-demo, and include Spring Web, Rest Repositories, Spring Data JPA & H2 Database. These libraries will allow us to quickly build functionality to persist objects to the database via REST endpoints.
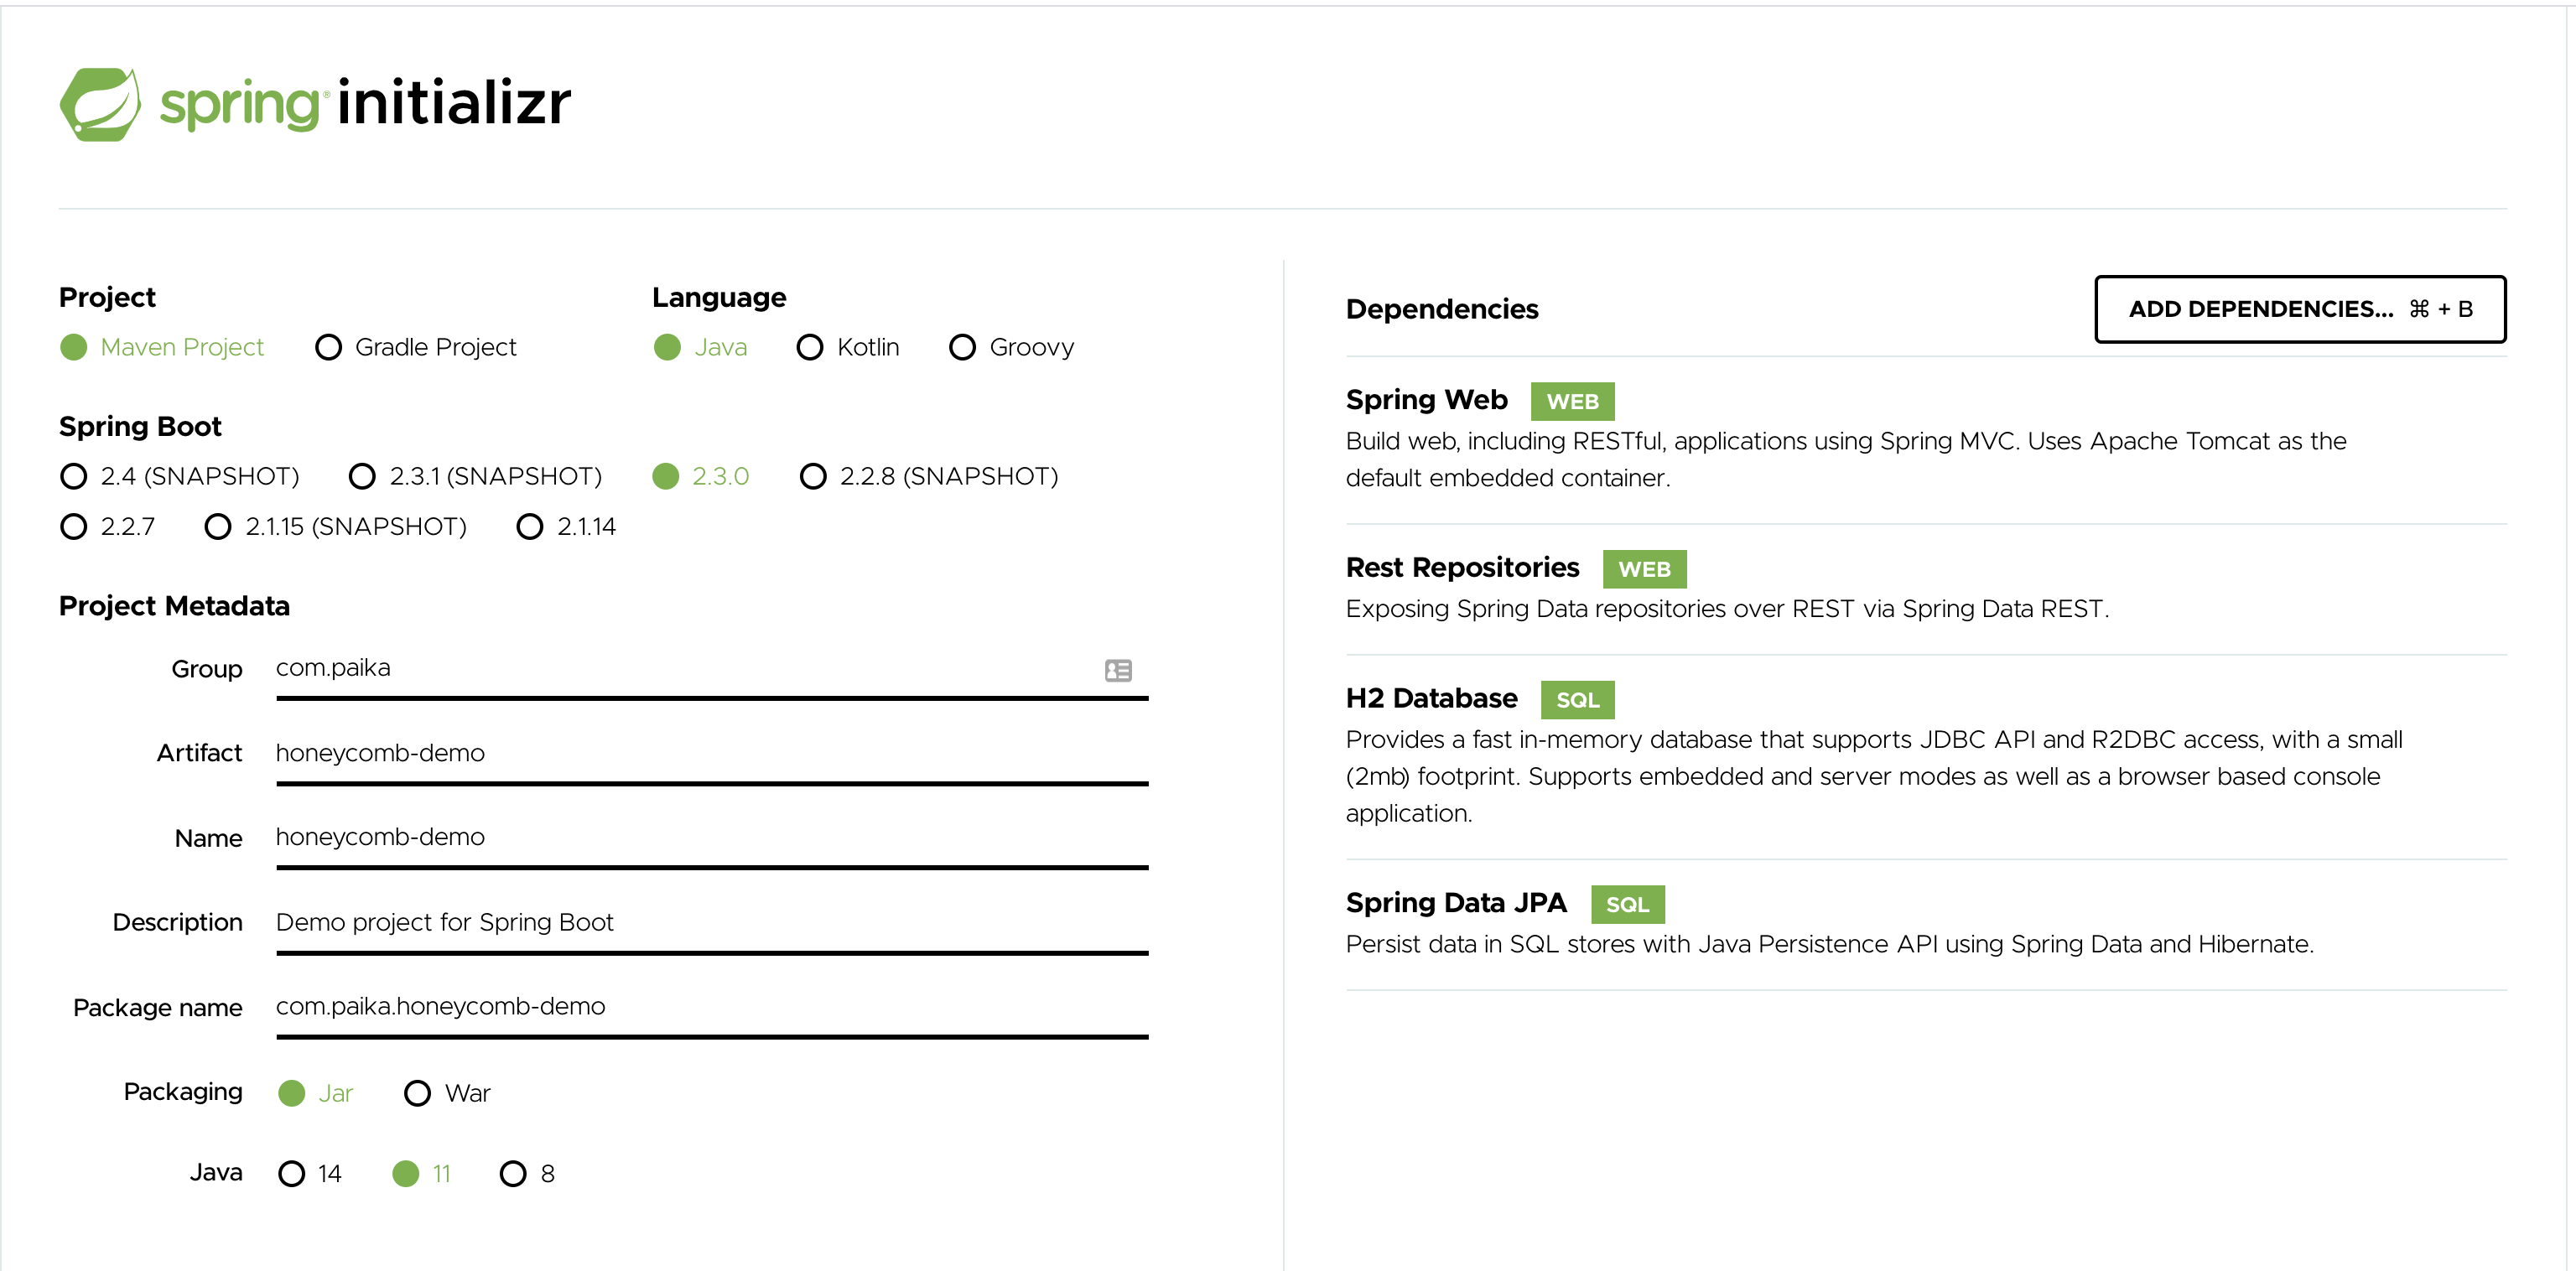
If you want to try something similar, this link has my configuration.
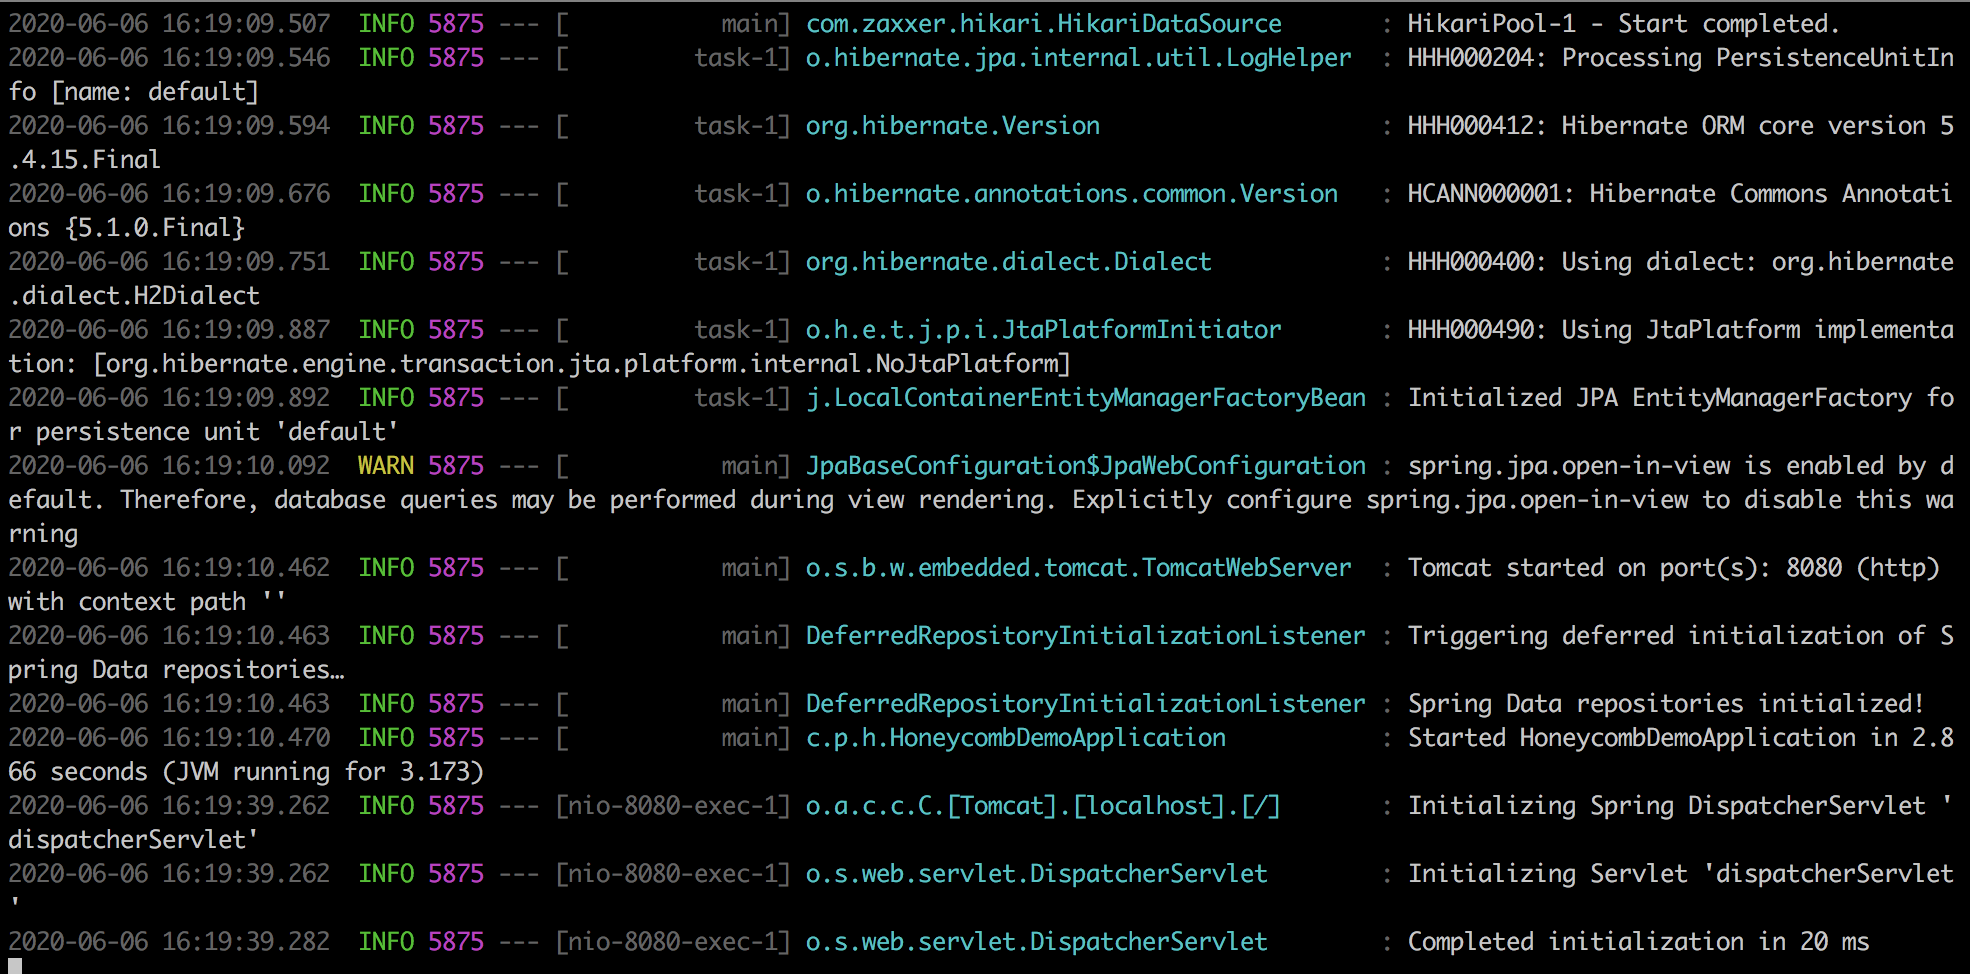
After downloading, unzipping, and making sure I had configured jenv to use the right java version, we can give the application a run with
mvn spring-boot:run
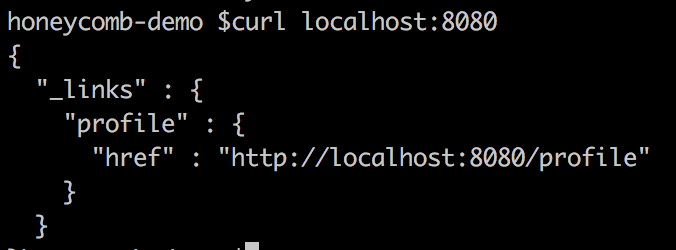
Then from a seperate terminal window, we can run curl localhost:8080/ and see a response from our app:
Lets add some functionality
Seeing as instrumenting an autogenerated application endpoint wouldn’t be that interesting, let’s add a POST and a GET endpoint. As we’re evaluating Honeycomb, let’s build a product for beekeepers! We’ll expose a POST endpoint for persisting Bees to our database, and a GET endpoint for seeing all the bees. Each Bee will have a name, and a bee catchphrase (duh!).
After a trip to my favorite Spring tutorial site Baeldung for a refresher on Spring Data Rest, let’s get started.
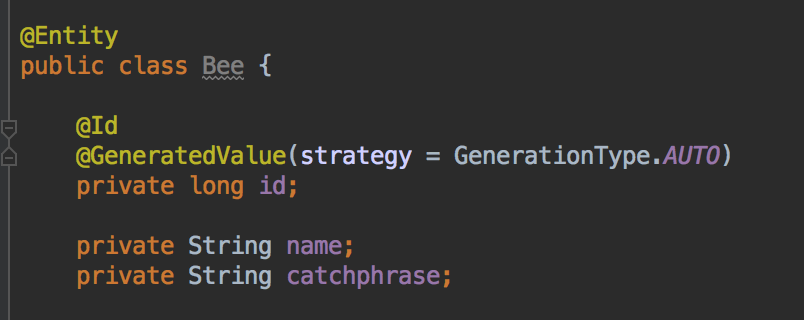
First, we’ll make a Bee domain object. Each Bee will have an autogenerated Id, a name, and it’s catchprase. Since we’re not doing Kotlin, the domain object will also have some autogenerated getters and setters that I’ll spare you from seeing.
We’ll also need to define a Data Repository, which will autoconfigure our Bee CRUD endpoints for us:
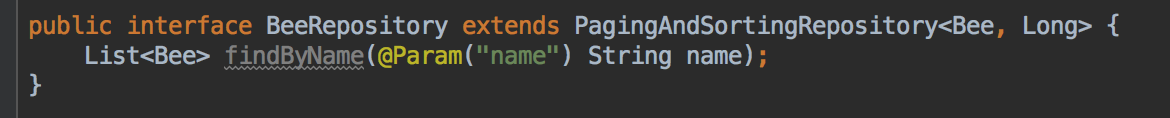
Now that the repository and the domain obect are setup, after rerunning the application we can use curl to send a POST request to persist a Bee object:

Spring Data repository is incredibly powerful. With only those two classes, it’s configured CRUD endpoints for interacting with Bee objects and collections. It even sets up pagination over the collection of Bees for us.
Setting up Honeycomb
Now that we have something built, let’s intrument it 🔎
Honeycomb recently restructured their pricing tiers, and now offer a generous free tier. It includes 20 million events per month and 60 days data retention. More than plenty for our purposes! The only thing not available in the free tier is their SLO product.
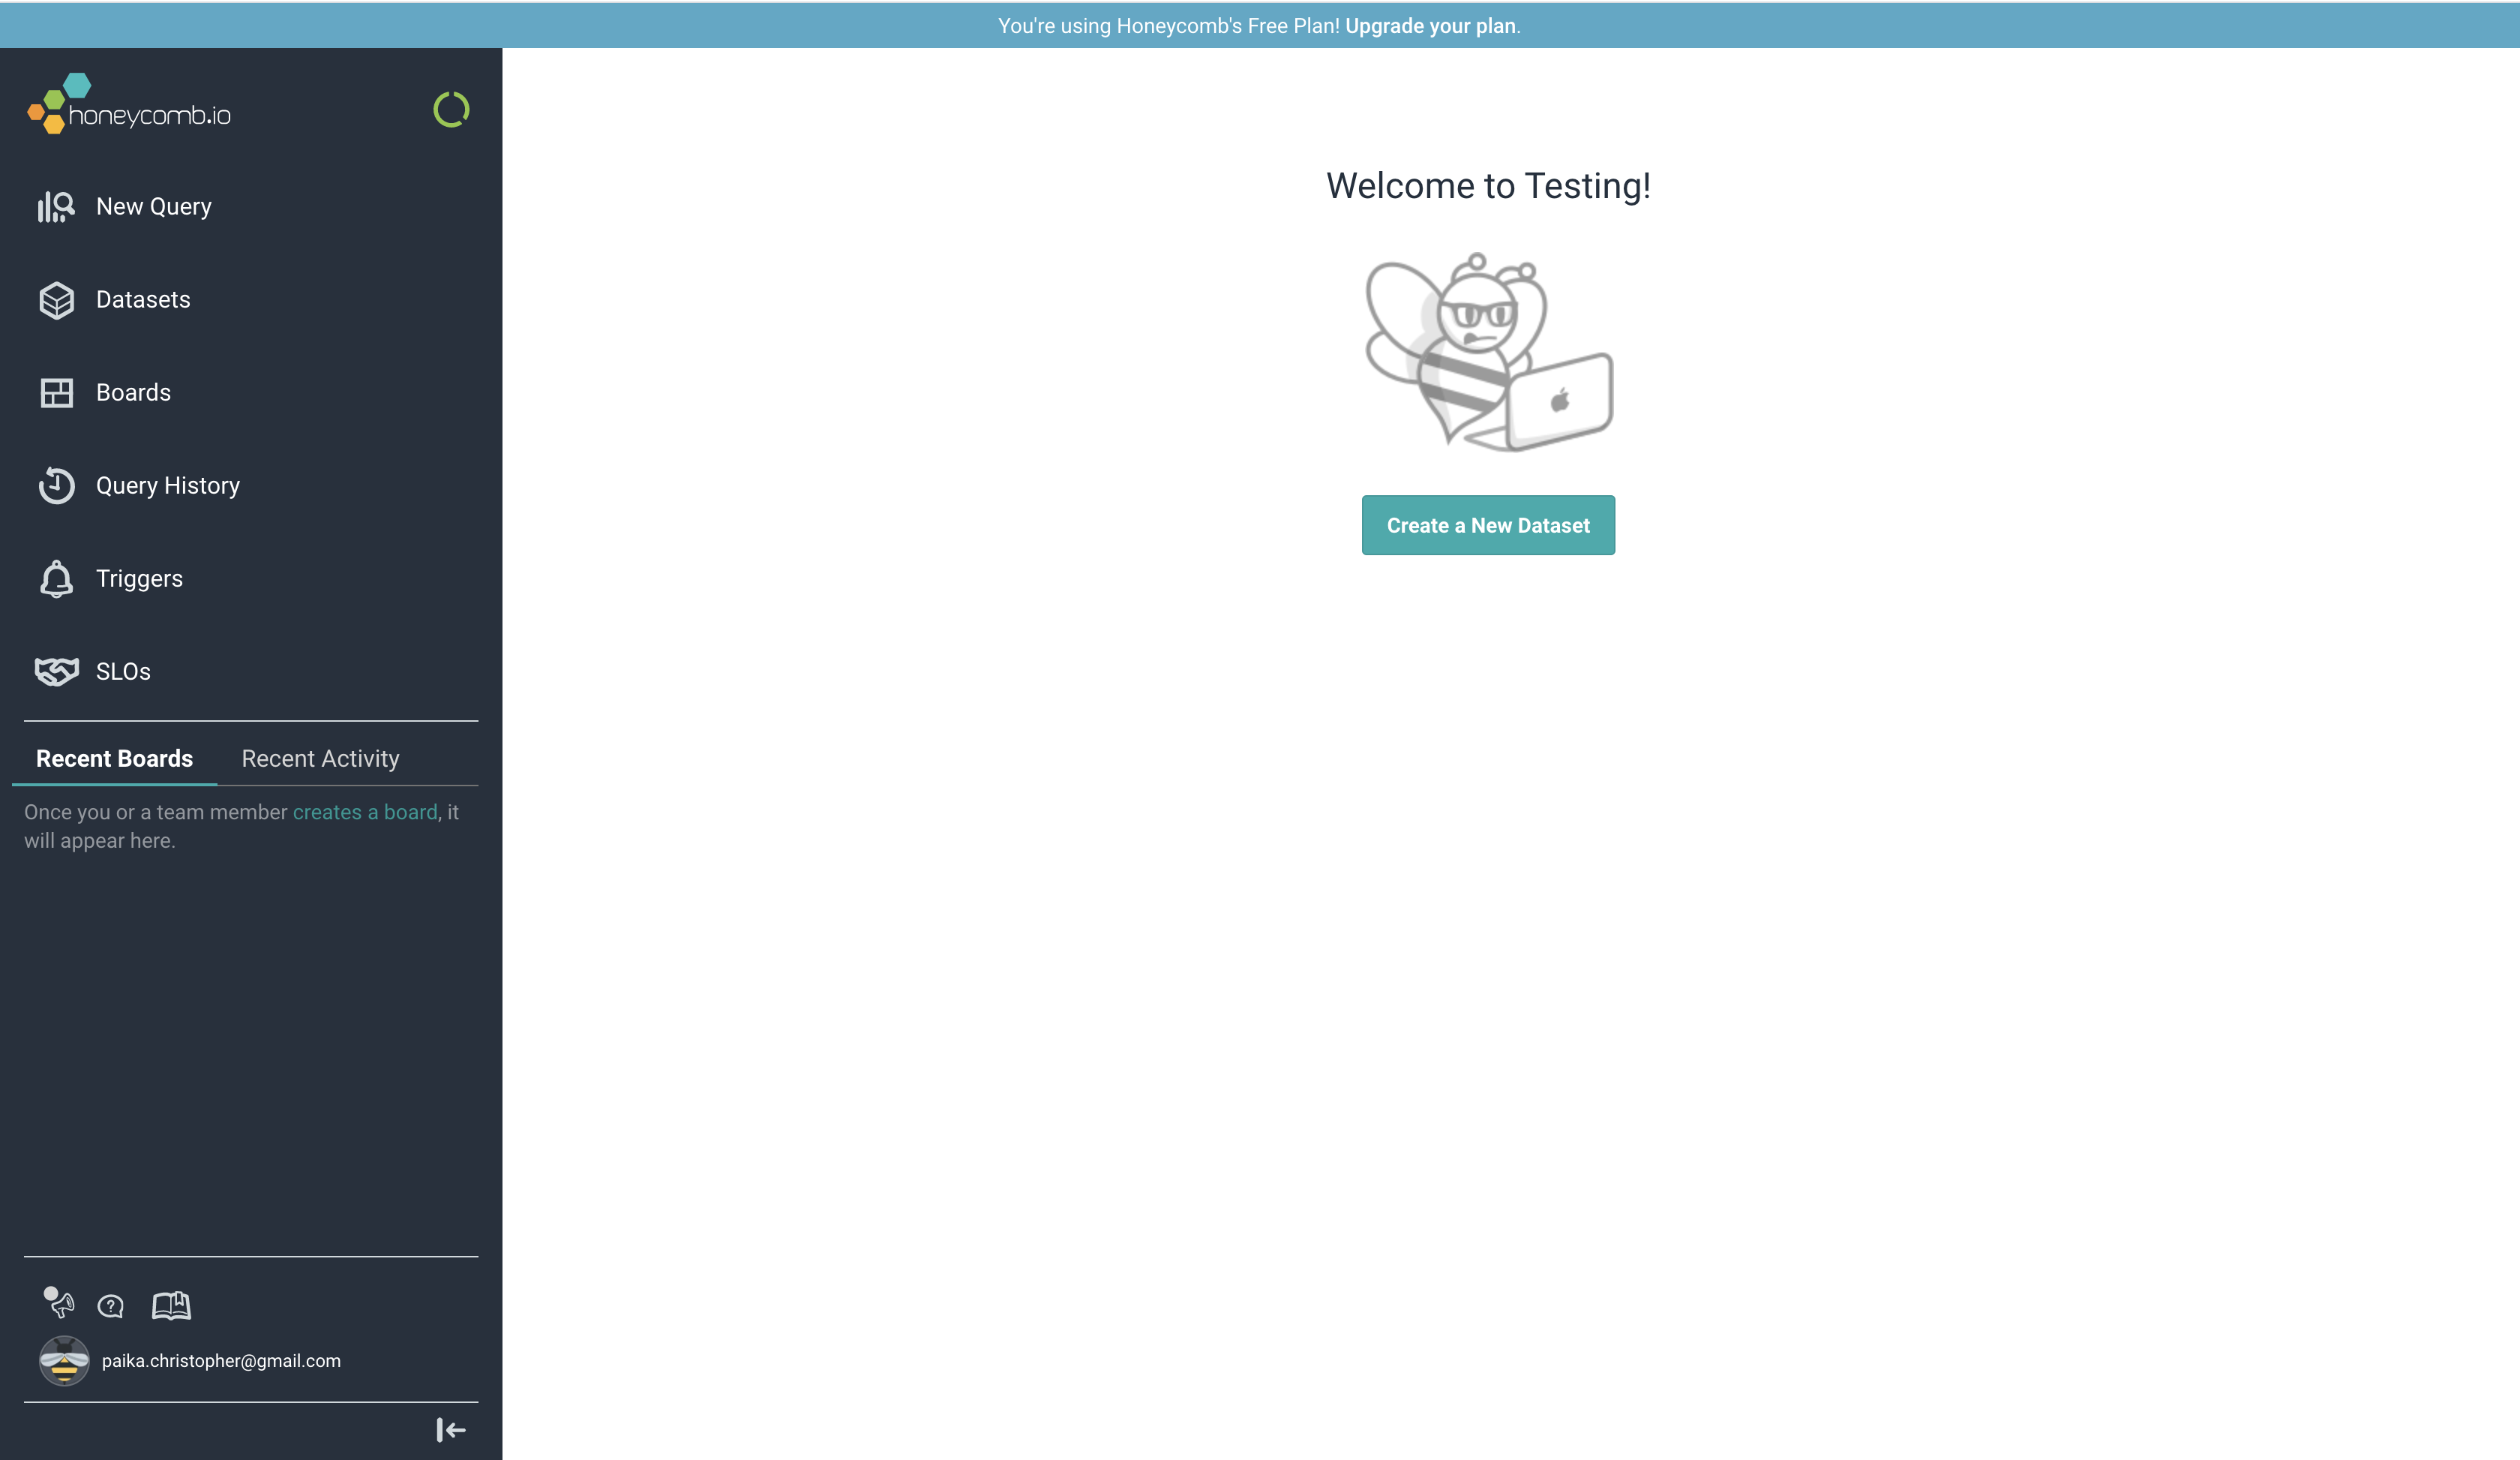
Upon setting up an account, you land on their above homepage. For a free account, your stuck with a blue top bar prompting you to upgrade. However if it bothers you as much as it bothers me, you can use Stylebot to hide the element, so you don’t have to see it. Maybe it’s things like this that makes it impossible for me to stay focused on one task…
Well once you’re finished ruining their carefully crafted css, we can click “Create a Dataset”, and choose Java as the language.
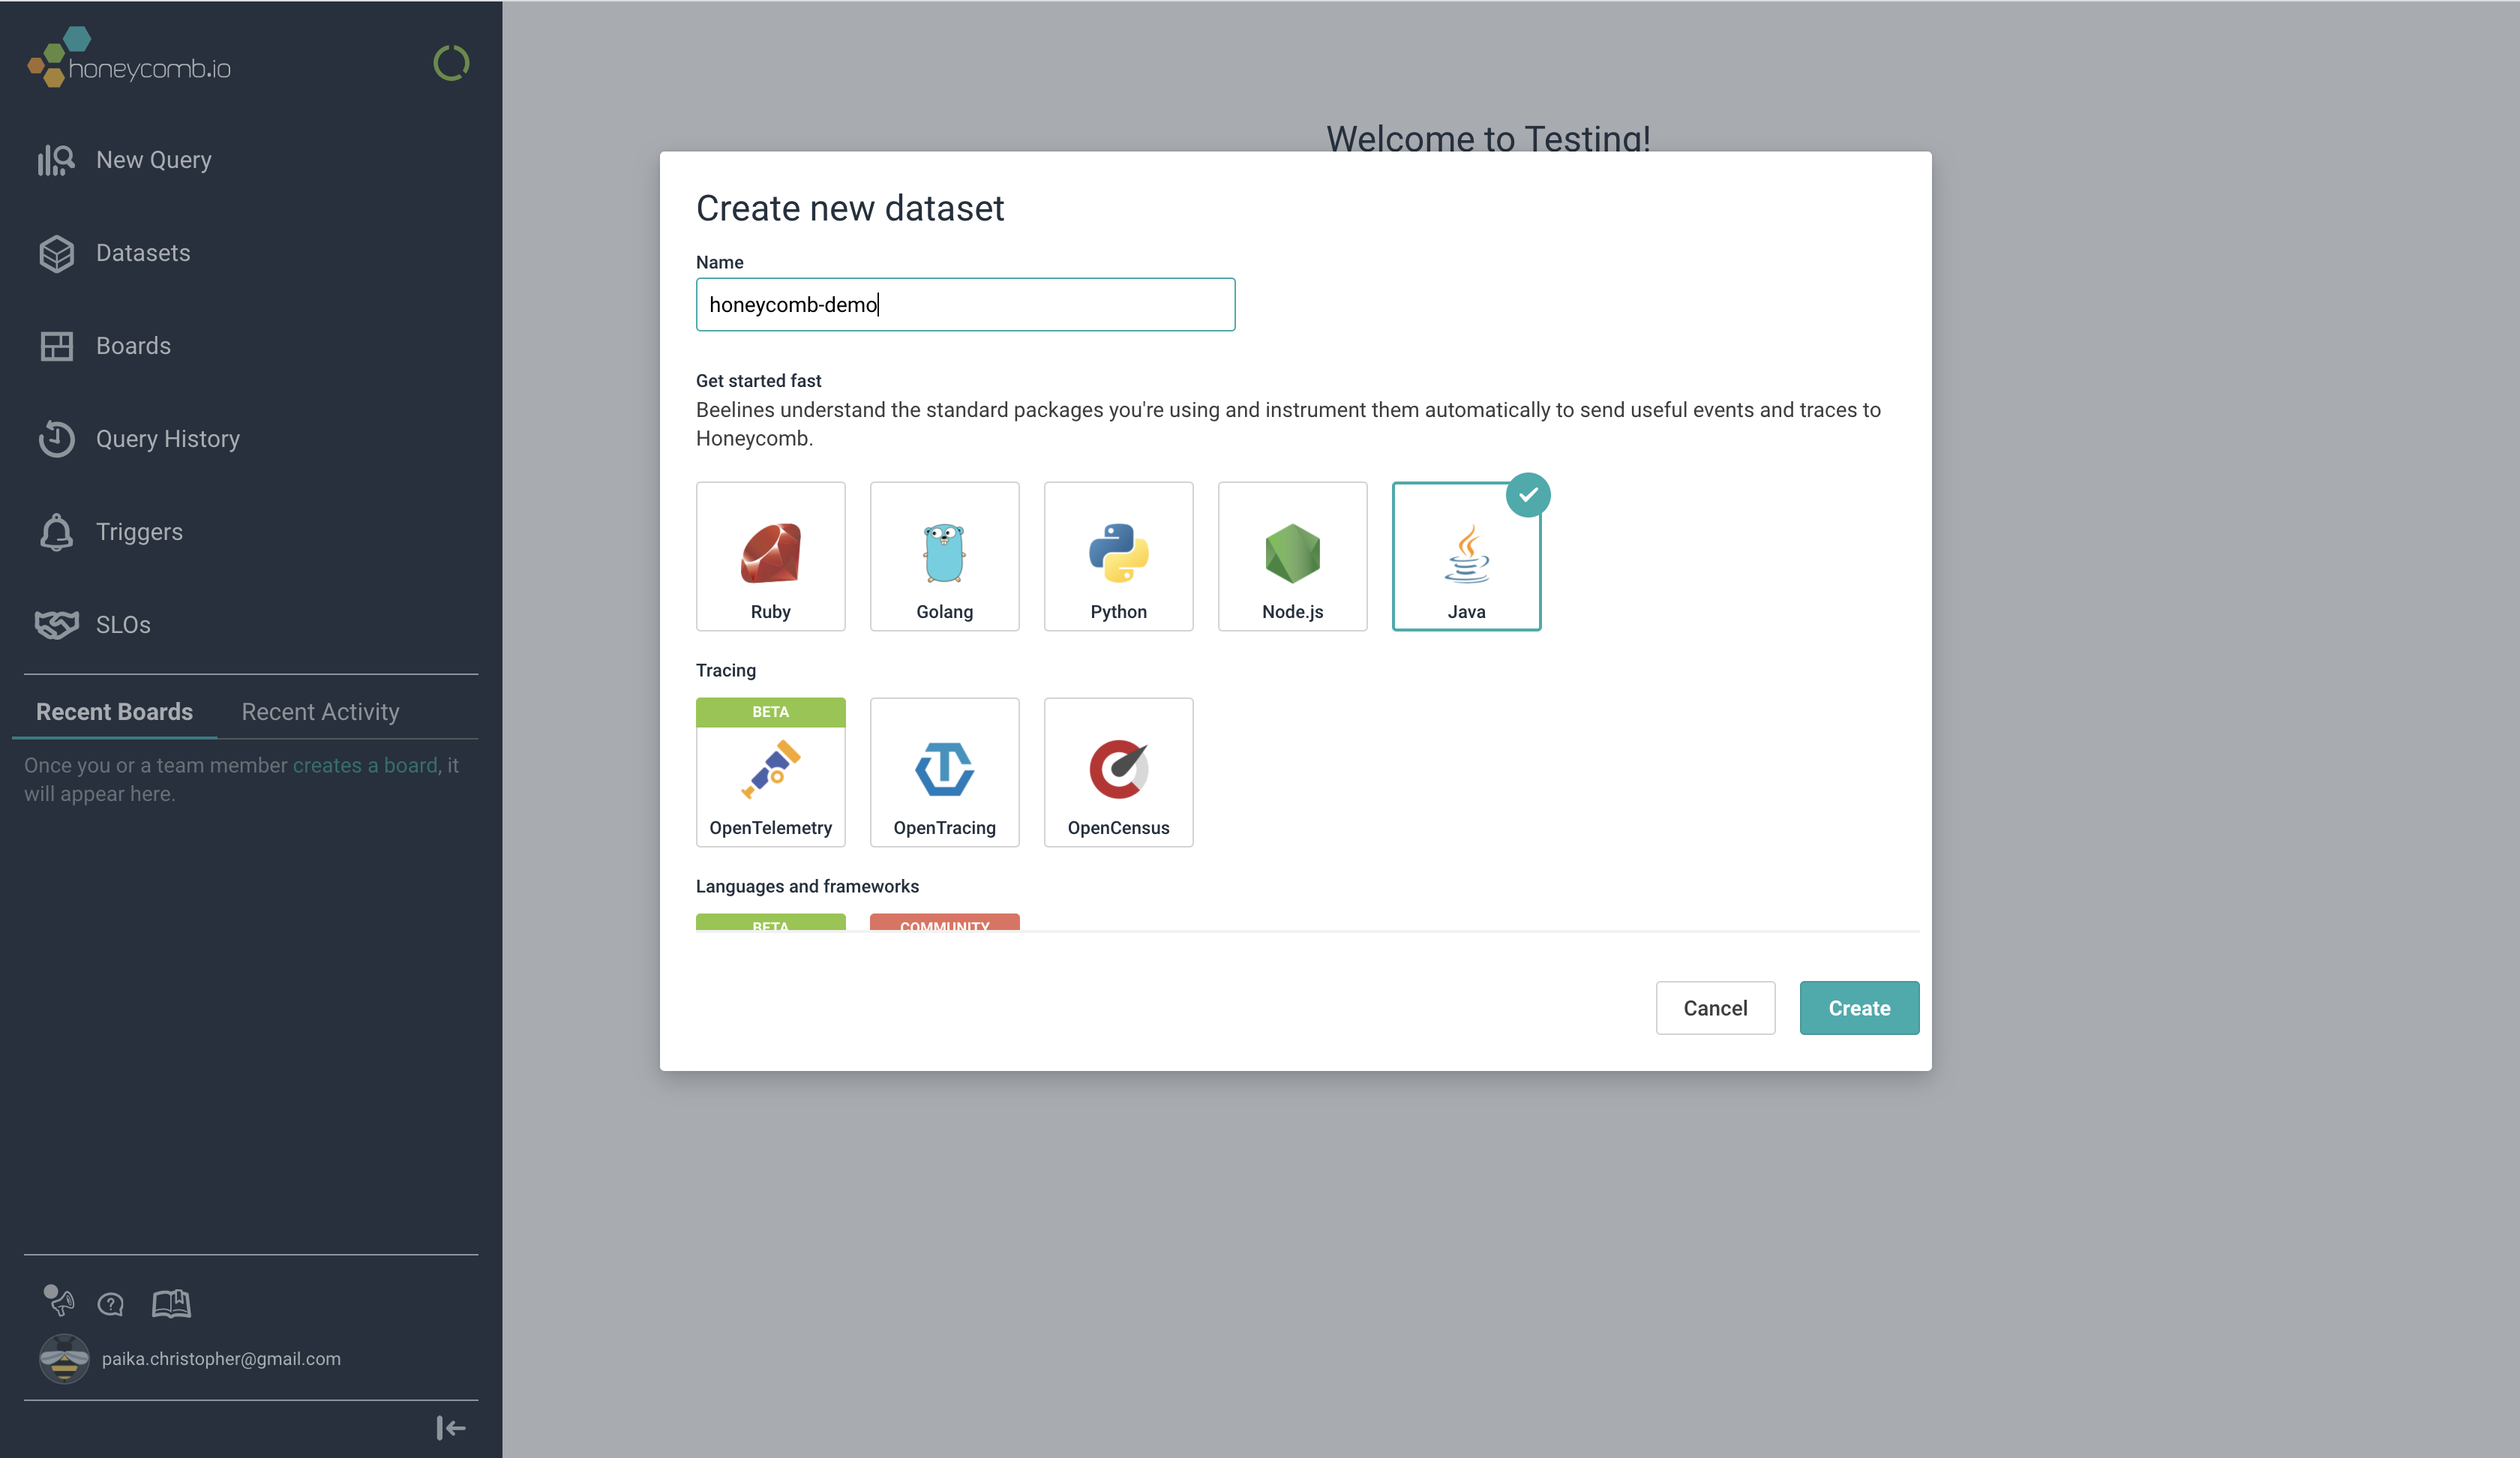
They bring us over to a page with instructions for integrating with Java. Particularly, they call out:
“The Java Beeline provides automatic instrumentation for Spring Boot v2”
Score! That makes it easy. Let’s follow these instructions.
First - we need to add the Java Beeline to our pom.
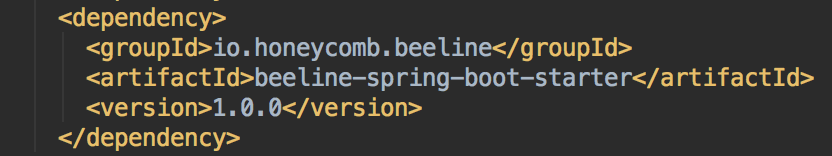
Their guide specifies version 1.0.0 - but are they really only on version 1.0.0? No updates since its been published at all? Looking on Maven Central, it appears so - they haven’t updated it since it was originally published in early 2019. I guess they got it right the first time!
Next, we need to add some properties to our Spring application.properties file. Honeycomb provides the configuration as part of their setup page, with API key and dataset names already filled in. It’s touches like that that really make you a happy non-paying customer!
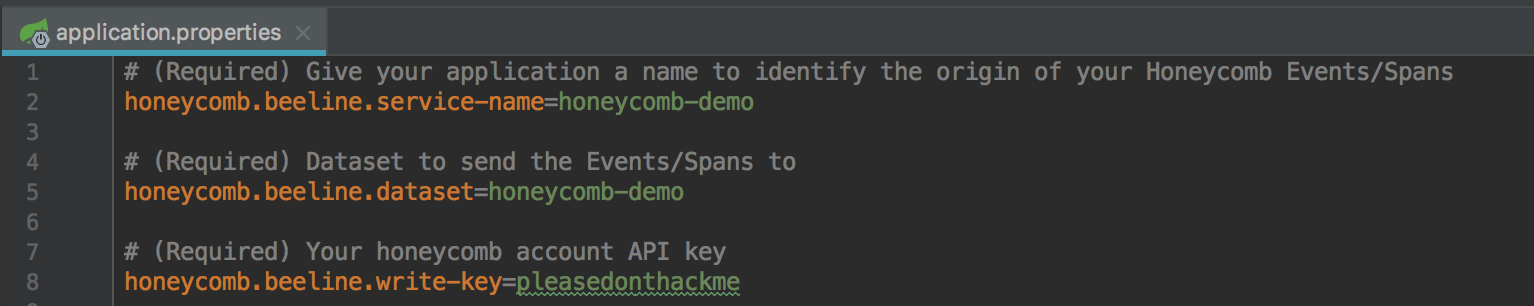
I did have to modify their properties slightly - they use a : in their properties file as a delimiter, which causes IntelliJ to complain about ‘breaking code style convention’. Switching them to = instead did the trick, as IntelliJ has default code styles it’s enforcing. According to the Java Properties documentation, either are perfectly valid deliminators.
There were also some optional config I removed to make things simpler. Hopefully I remember to delete that API key before commiting this to source control 🤞
Now, after rebuilding the server and sending a test POST request from the terminal, our app is instrumented and Honeycomb is receiving data!! 🎉🎉
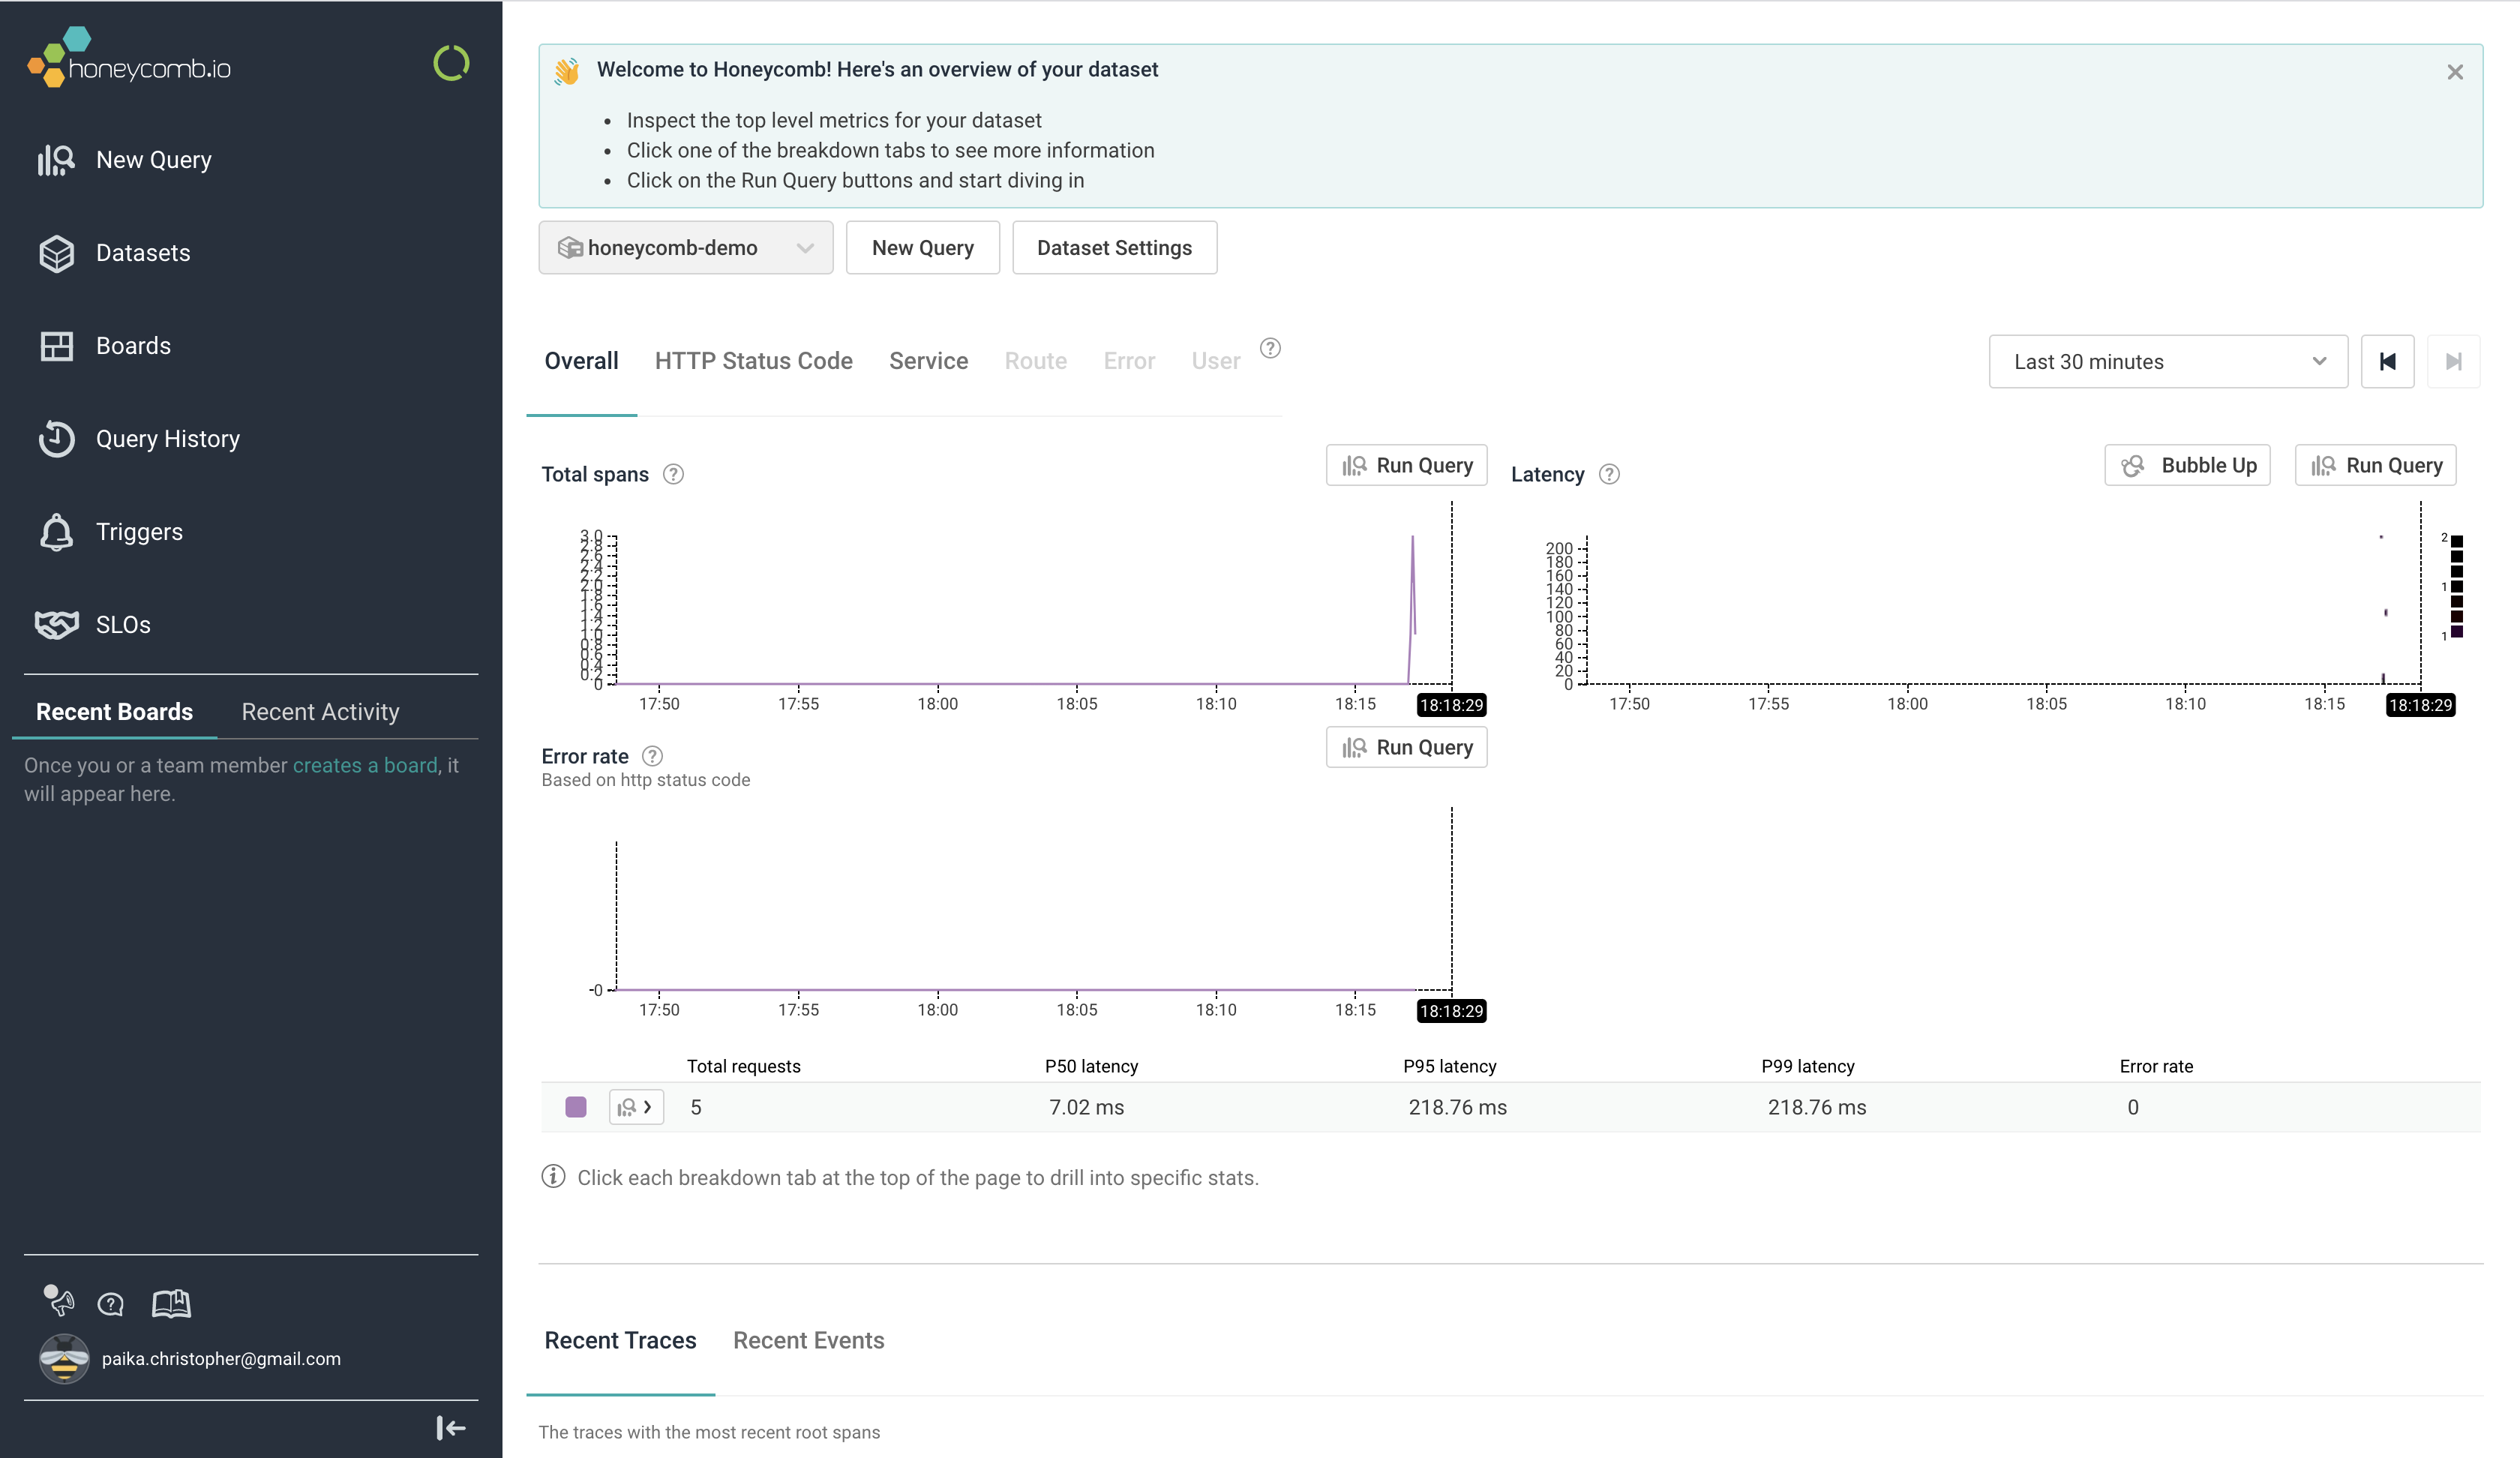
Other than the slight visual bug where the y axis labels are squished, it looks great.
I particularly like the emphasis on the p50, p95 & p99 traffic. That already gave me my first insight - why did one of my curl requests take 218 ms?
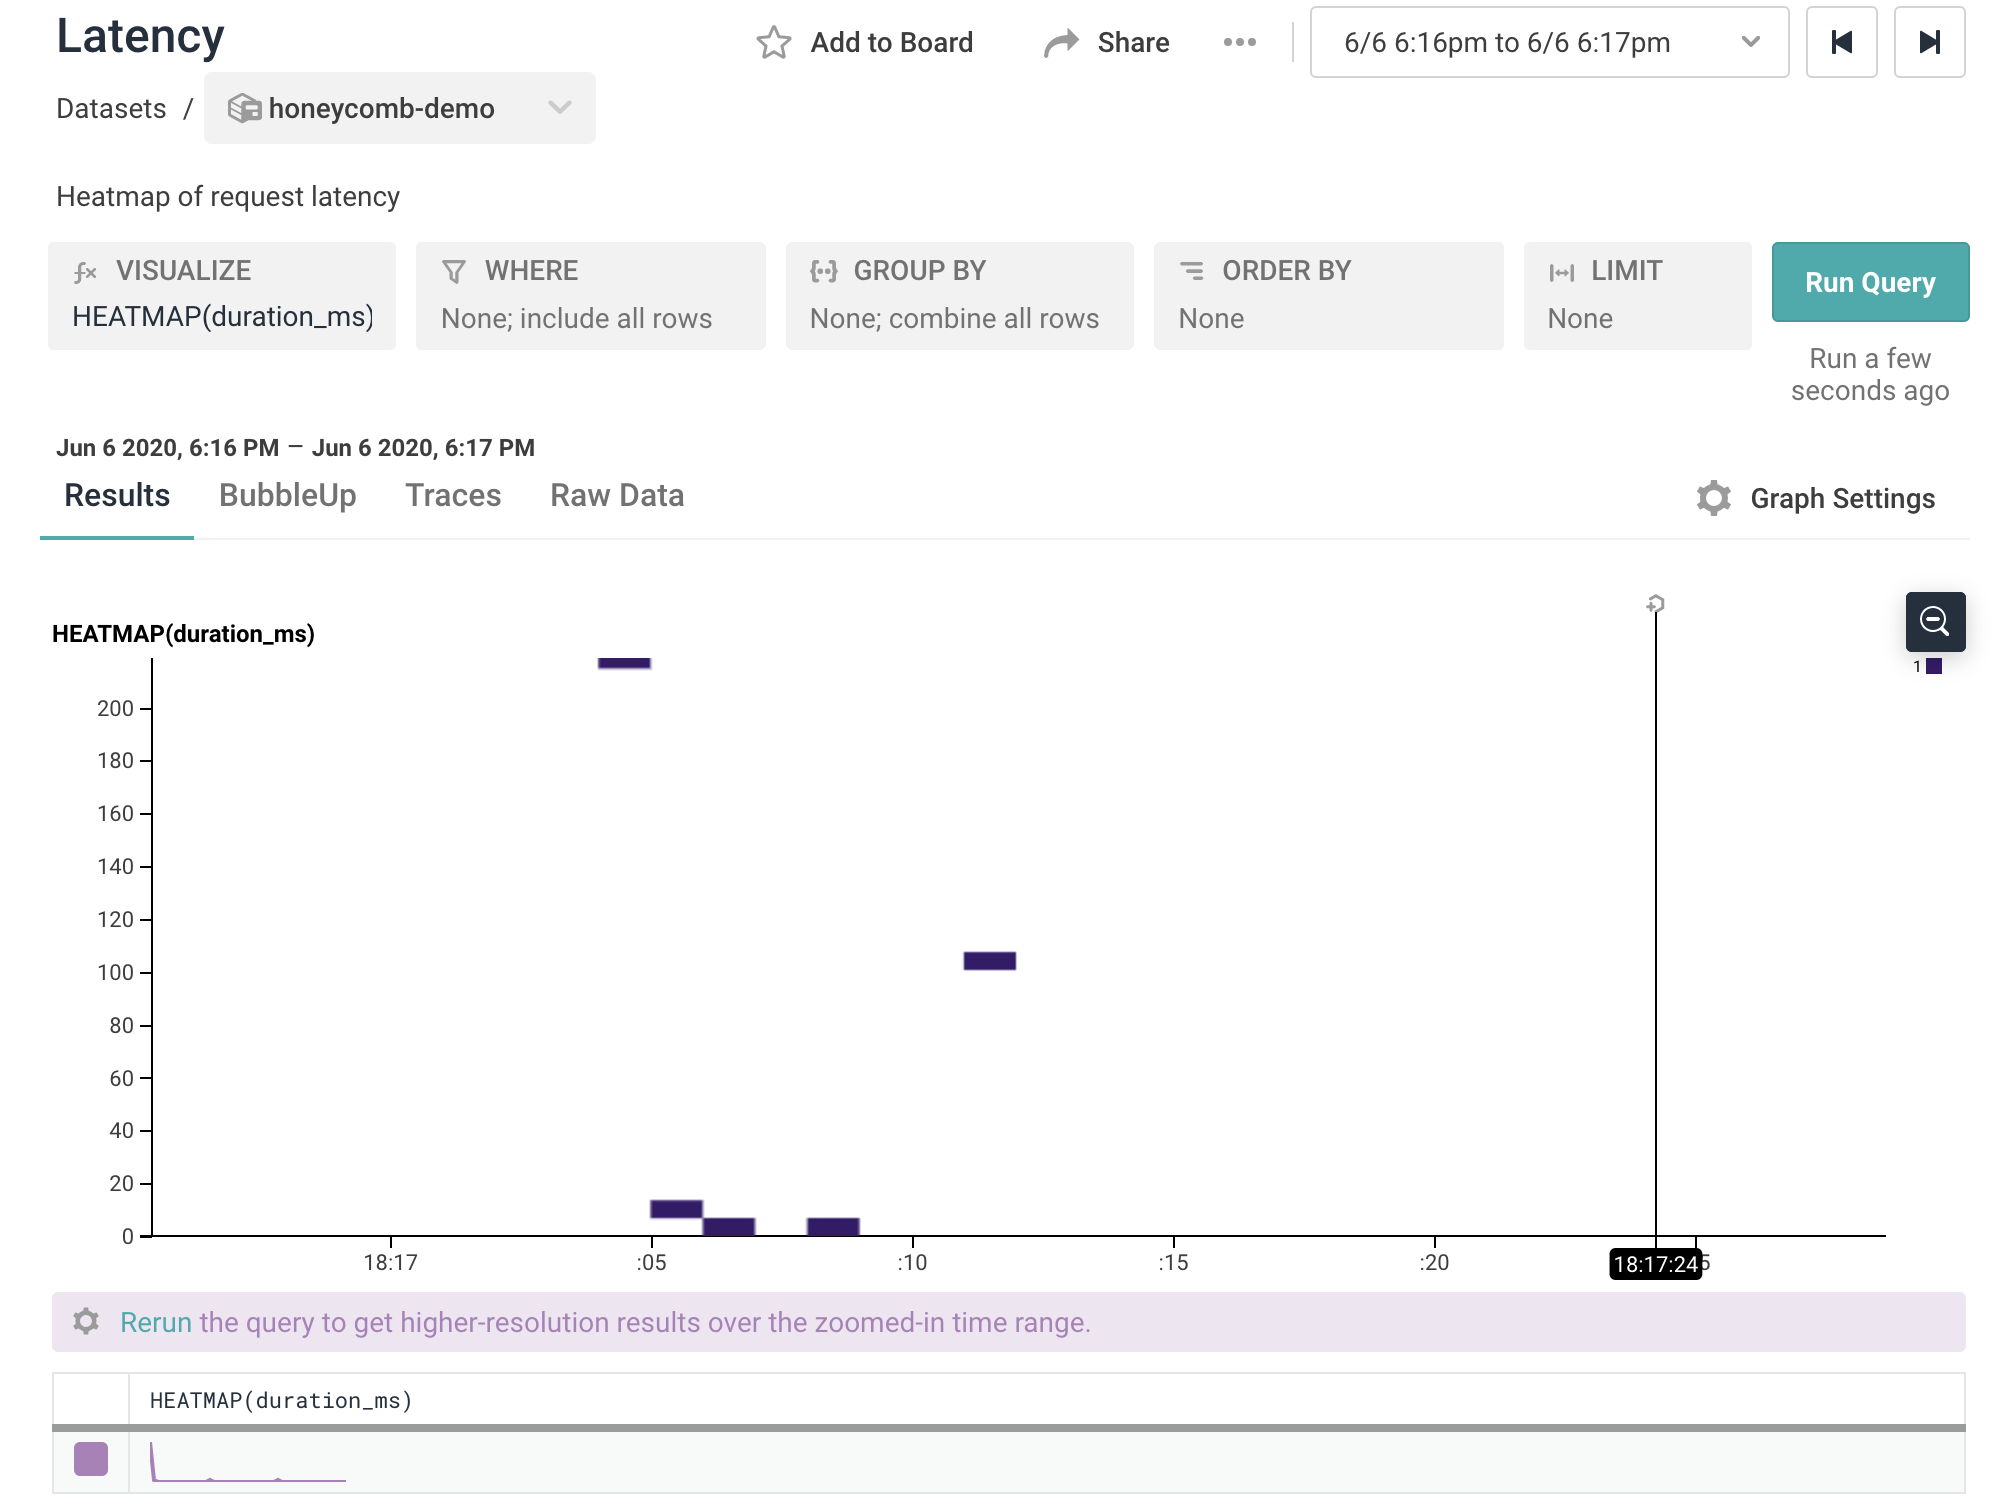
Clicking into the Latency chart, we can zoom in on the requests in question. There we see that it was the first request to the server that took 218 ms - which makes sense. The server had recently started, and Spring often needs a request or two to establish connections and “warm up”.
Mocking some user traffic
Great! Now that we are instrumented, we need some actual data rather than me running curl commands over and over again.
My performance testing tool of choice is Artillery. It’s powerful and flexible - it can be configured via command line arguments directly, or a configuration file. You can follow the setup guide here to get started using it.
I put together a configuration file to run against our local server. It will ramp up users over 60 seconds, have peak load for 60 seconds, than ramp back down. Each user will POST a Bee, and then make a GET to get a list of all the Bees.
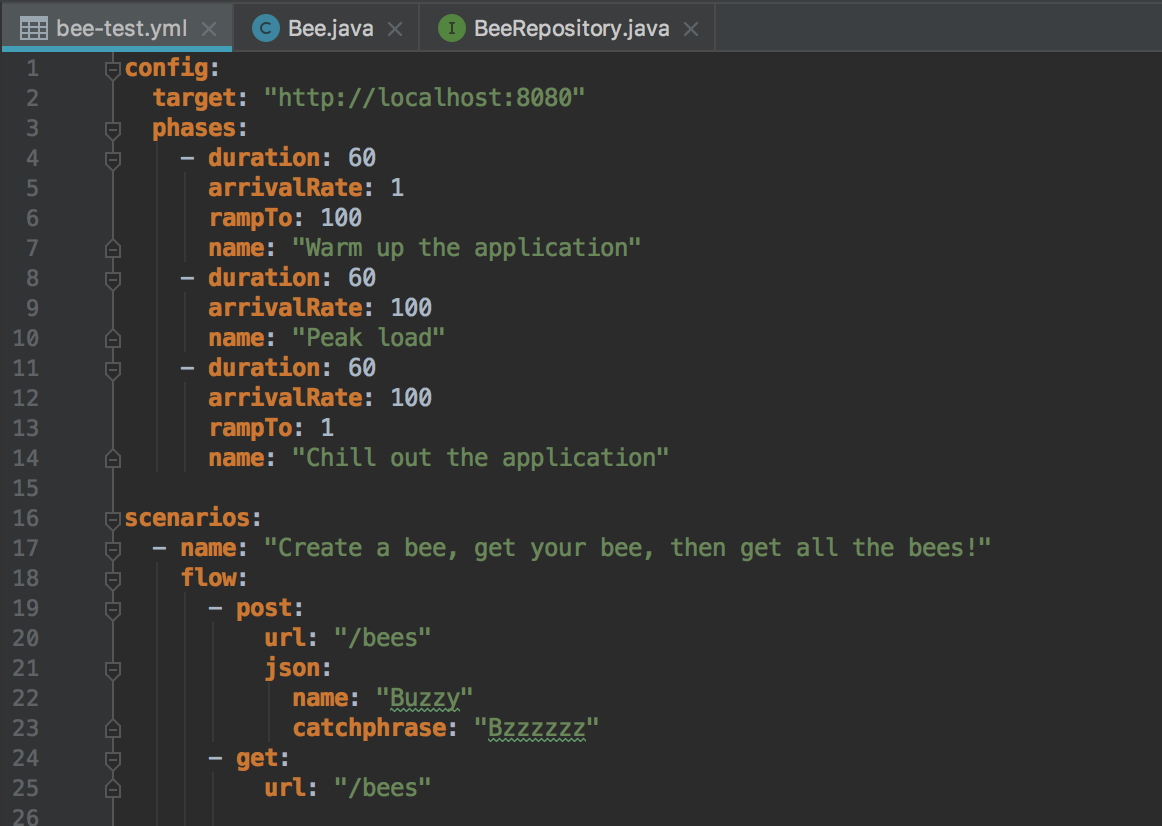
After giving it a run with artillery run bee-test.yml (and going to get some more tea) we can see the results in Honeycomb!
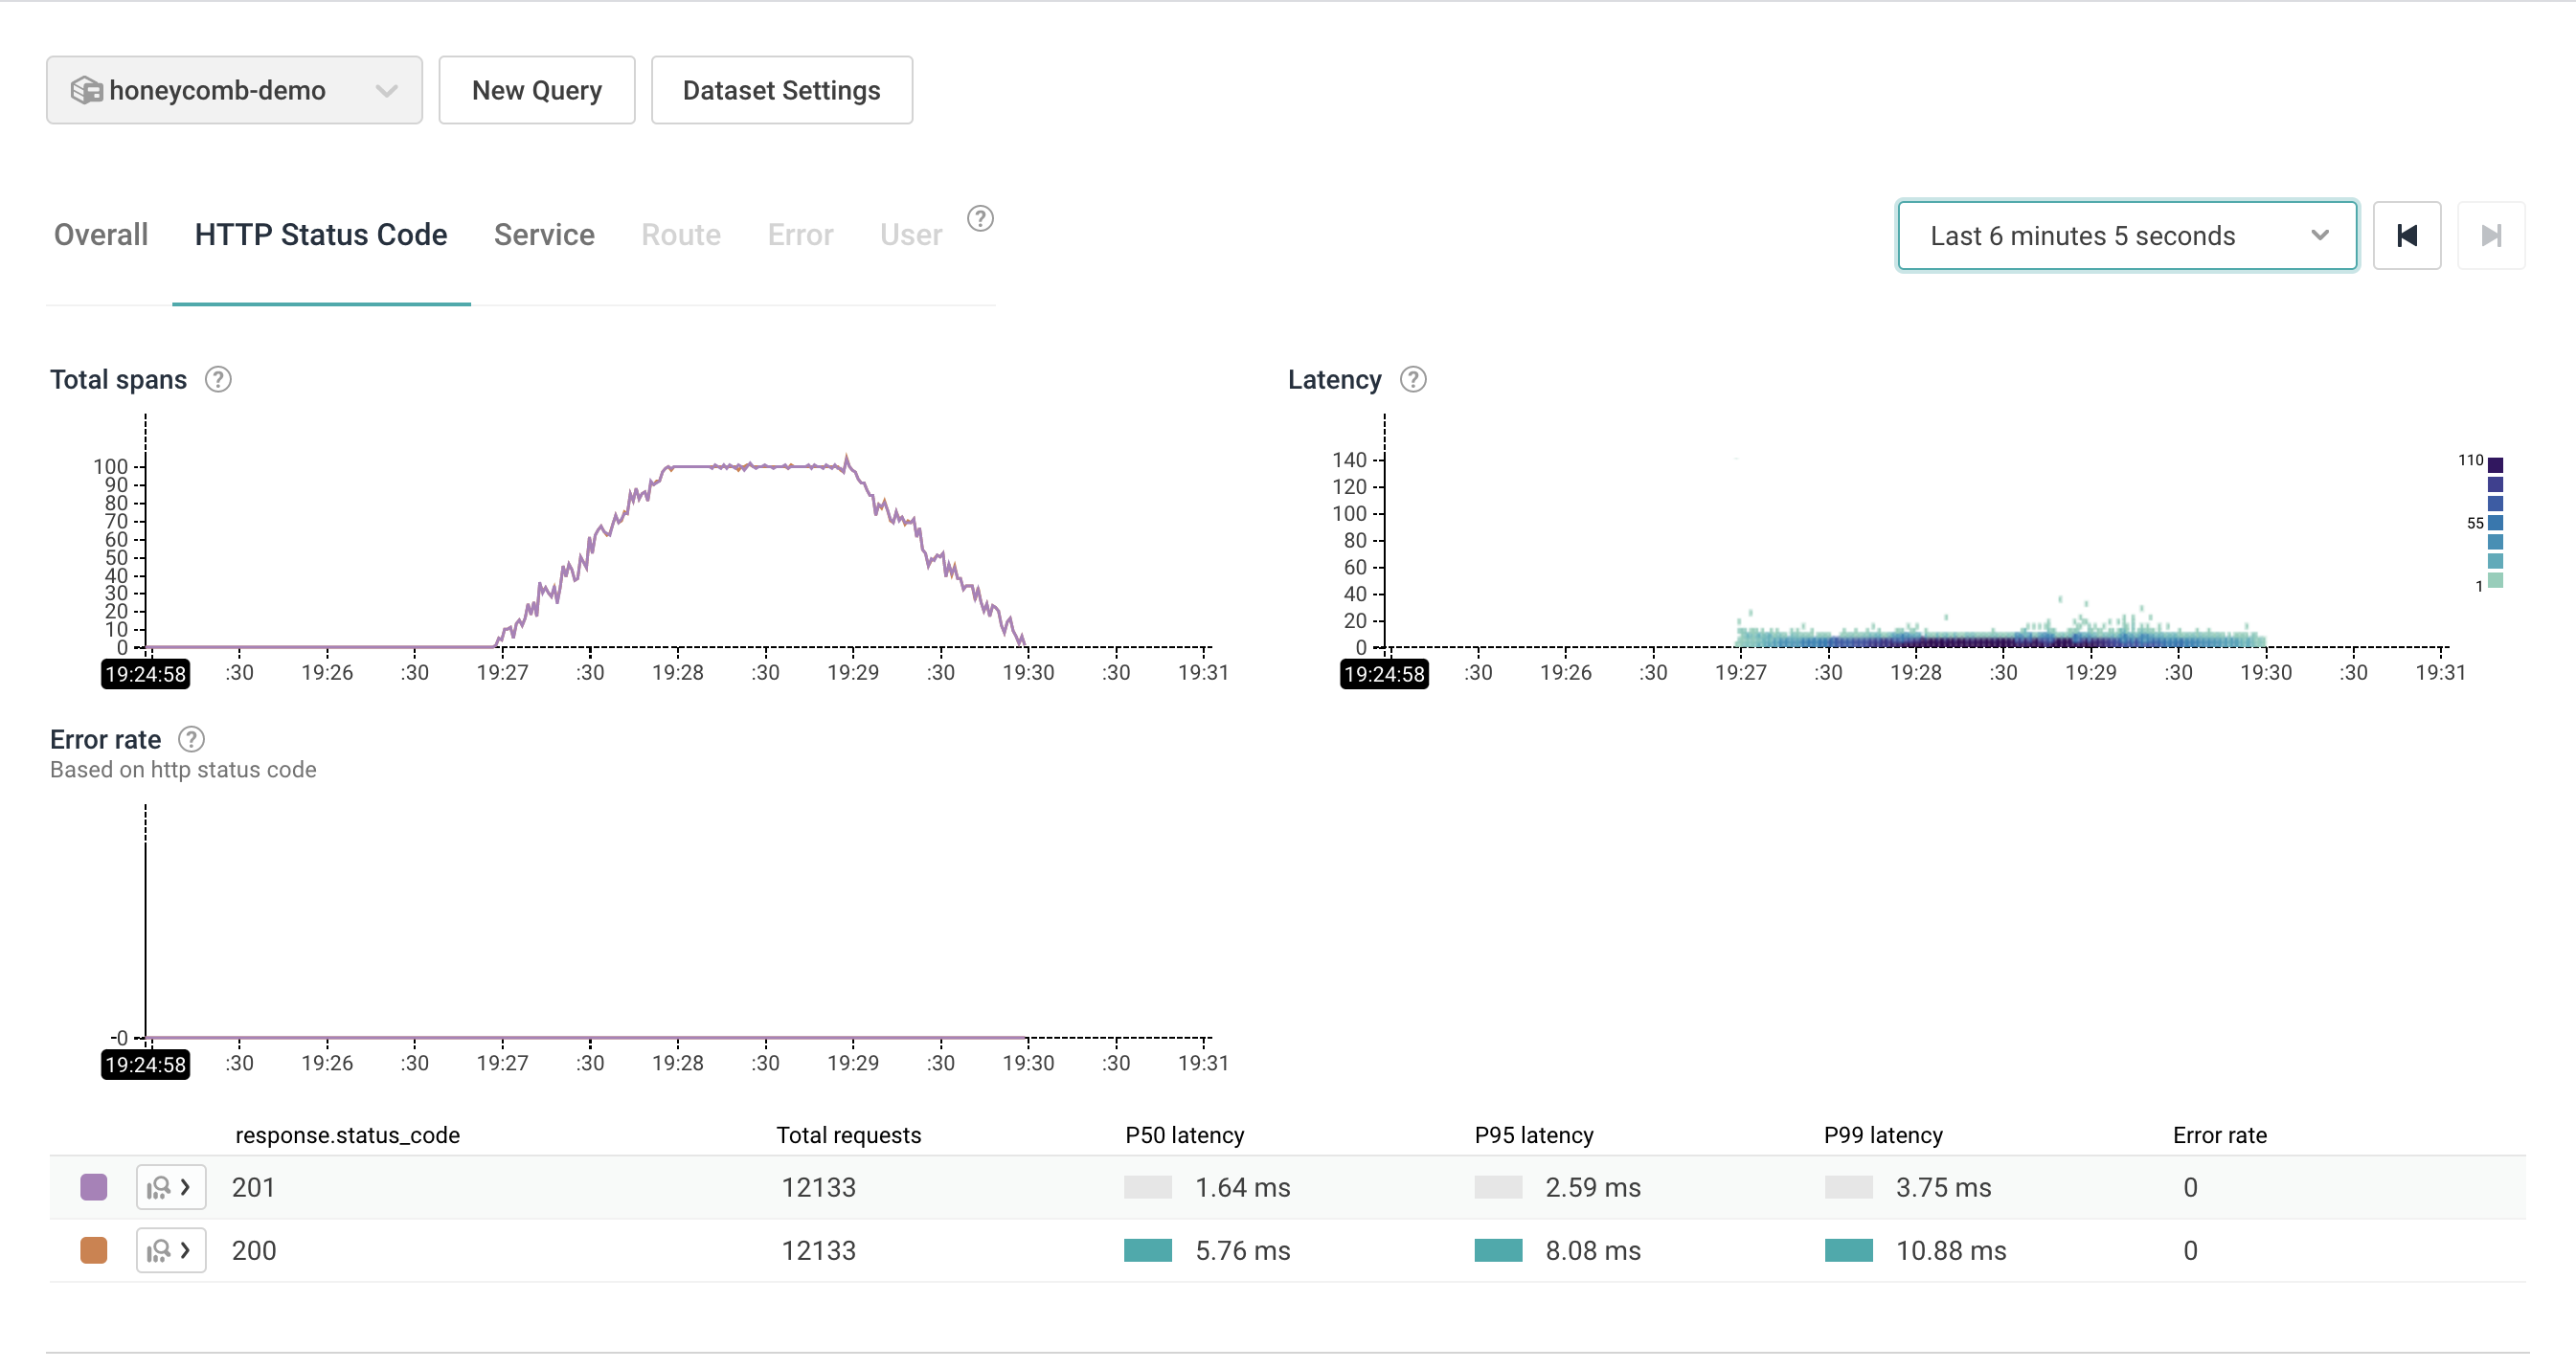
Perfect! In the Total Spans section we can clearly see the ramp up, the stable period, and the ramp down.
However, only ramping our Artillery test to 100 users? That’s boring. Let’s tweak that config to 11:
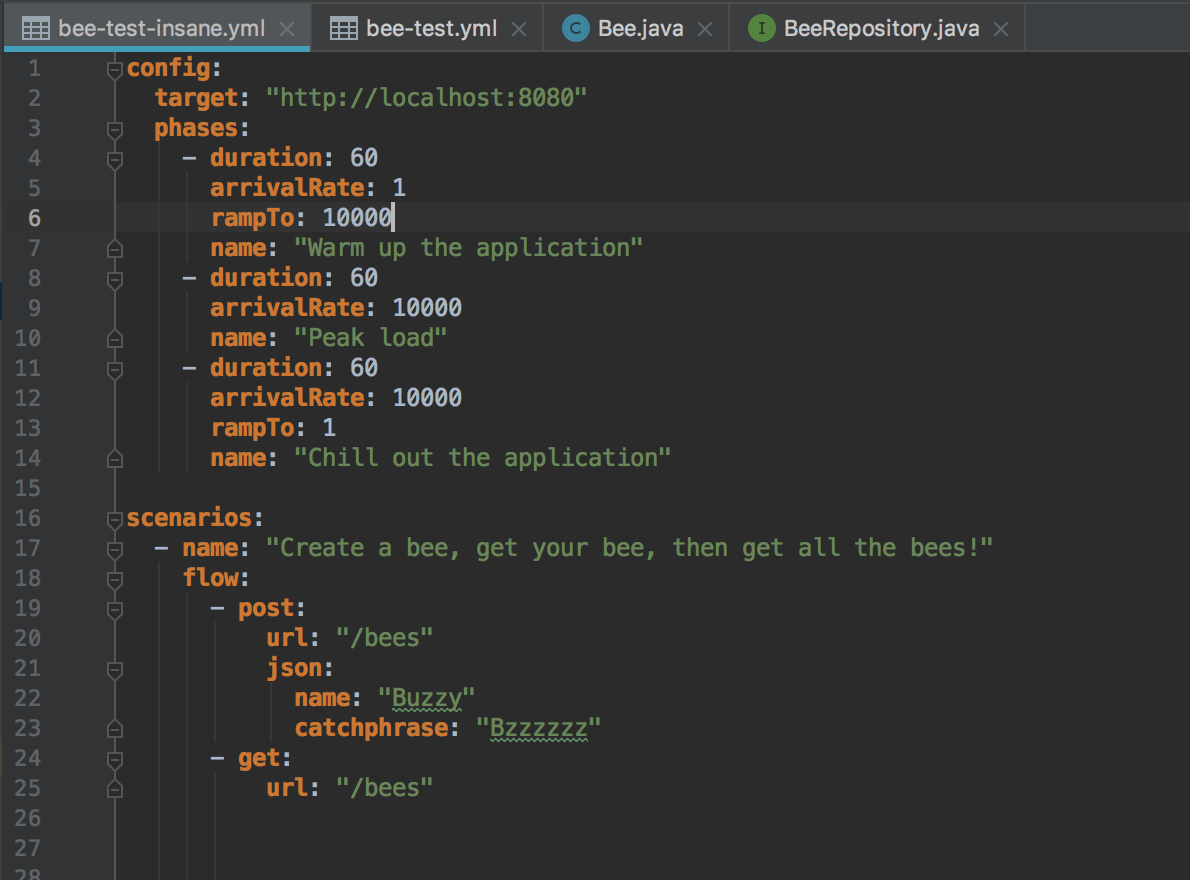
10,000 users in 1 minute? Now were cooking with gas!
After plugging my laptop in, running artillery run bee-test-insane.yml, and crossing my fingers, here are our Honeycomb results:
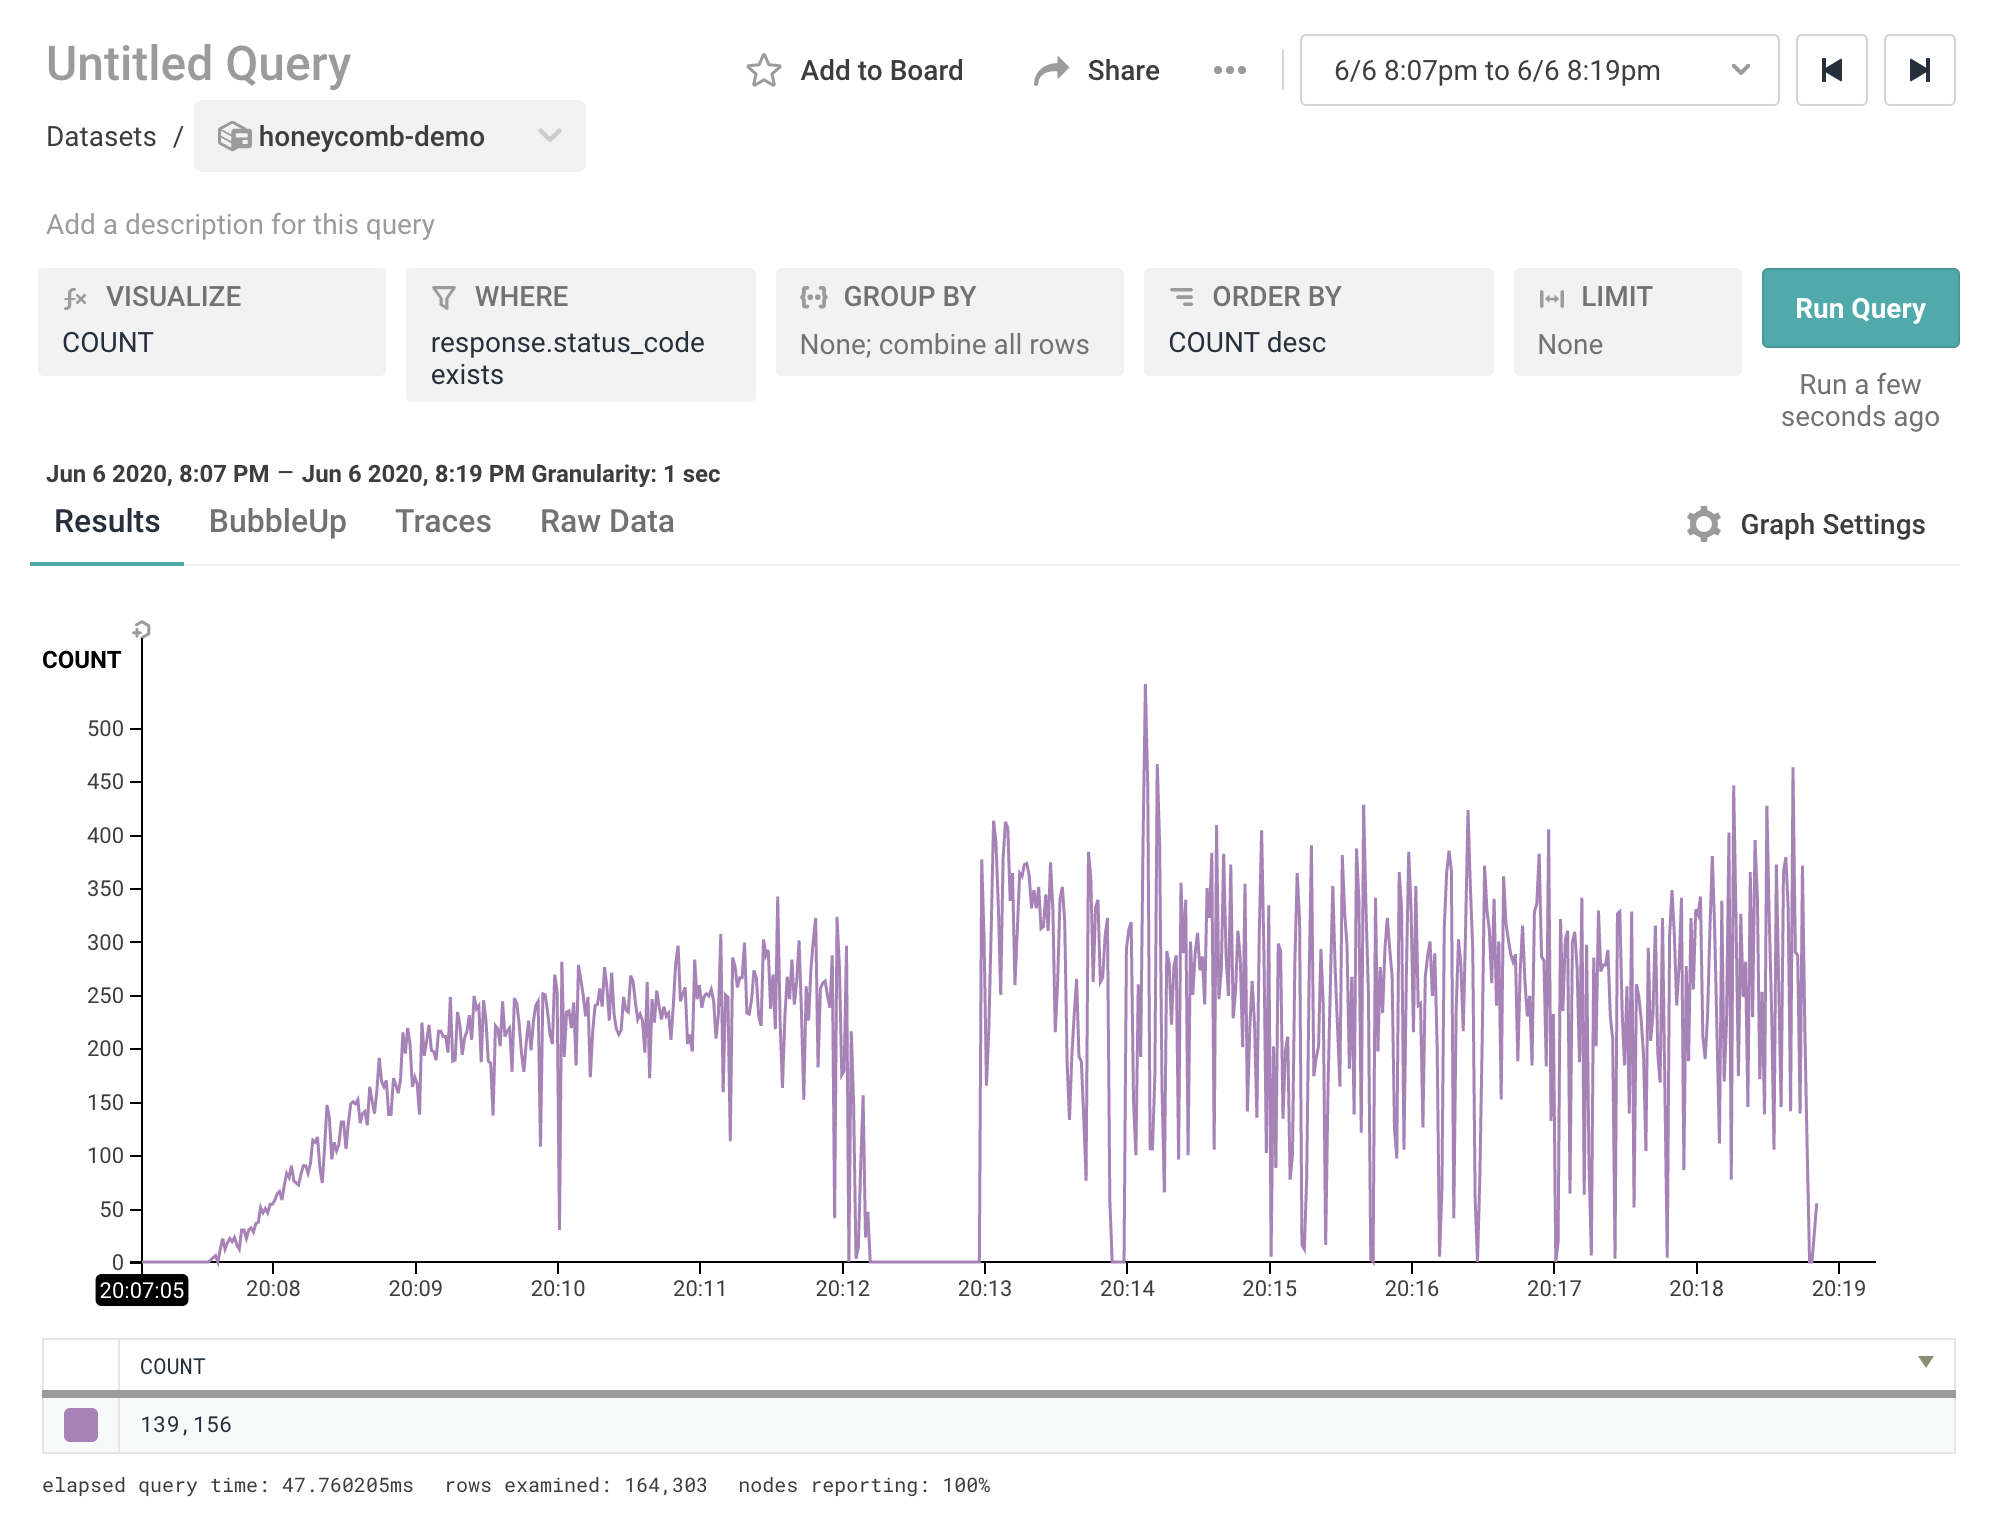
And…they’re not great. It looks like our server maxed out at receiving around 250 events per second, when it should of been much higher. Artillery was likely the issue - the P90 response time of the demo application never exceeded 30 ms, it didn’t seem to have a problem processing the load. That implies Artillery was the problem, and it hit a limit on the number of requests it could generate concurrently. Alas, running a 10,000 user/minute test from a local machine doesn’t yet seem possible.
How much did that cost?
Now that we’ve finished our load test, let’s look at our Honeycomb usage. If there’s one thing I’ve learned from working with AWS - it’s never forget to check the bill. Luckily, Honeycomb makes it quite easy to see your usage.
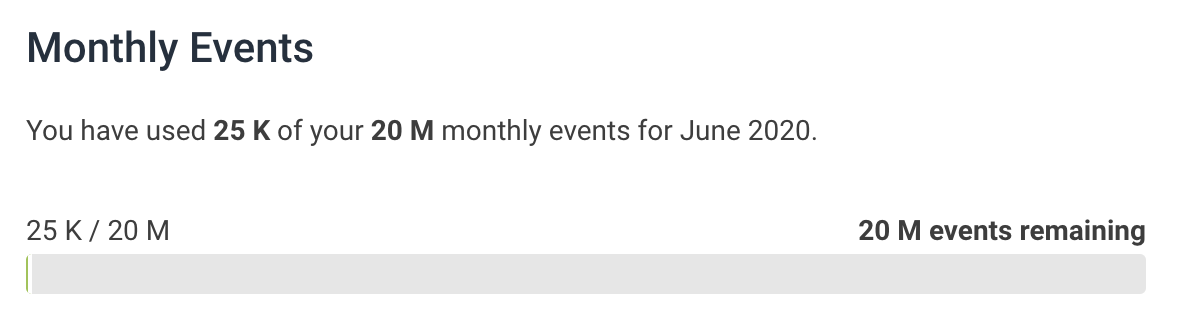
With some pretty hefty load tests we’ve used only 0.125% of our events budget for the month. The free tier Honeycomb offers is super generous.
The End
So that’s my journey through instrumenting a Spring Boot app with Honeycomb. Since we had a lot of ground to cover we’ve stuck to the surface level of Honeycomb in this post. In future posts we’ll dig deeper into the Honeycomb query builder and custom instrumentation. For now - happy monitoring 🐝🐝🐝